

Gravestone Doji Candle Signaling Trend Reversal: A Comprehensive Analysis
In the world of technical analysis, candlestick patterns are powerful tools that help traders understand market sentiment and predict future price movements. One of these crucial formations is the Gravestone Doji, a unique candlestick pattern that often signals a significant trend reversal. In this article, we will explore the nuances of the Gravestone Doji, its characteristics, implications, and the strategies traders can employ to use this pattern effectively.
What is a Gravestone Doji?
The Gravestone Doji is a single candlestick pattern characterized by:
1. No or an extremely small real body: It signifies that the opening and closing prices of the candle are either identical or very close, forming a negligible difference.
2. A long upper shadow: The shadow represents the highs of the trading session, indicating that bulls tried to push the price higher but failed by the end of the trading period.
3. No lower shadow: The absence (or minimal presence) of a lower shadow suggests that there was little to no downward movement during the session.
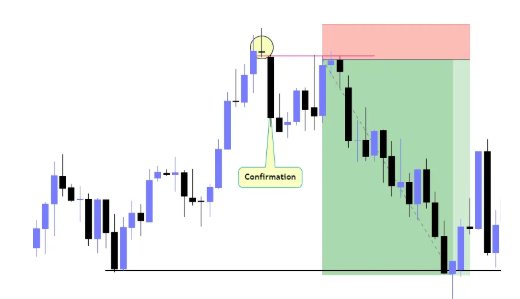
The Gravestone Doji resembles a "T" shape, mirroring the appearance of a gravestone, hence its name. Its distinct formation is often packed with information about market sentiment, particularly when it appears at the peak of an uptrend or the bottom of a downtrend.
Significance of the Gravestone Doji
The meaning of the Gravestone Doji depends on its position within the broader price chart and trend. Below are the key interpretations:
1. Bearish Trend Reversal:
When a Gravestone Doji appears at the top of an uptrend, it may signal weakening bullish momentum and an impending bearish reversal. In such cases, the long upper shadow represents an unsuccessful attempt by buyers to continue driving the price higher, indicating increased selling pressure.
2. Bullish Trend Reversal:
While less common, a Gravestone Doji can appear at the bottom of a downtrend. In these scenarios, it may indicate that bears struggled to maintain lower prices, giving room for bulls to regain control. However, traders should seek confirmation through subsequent candles to verify this pattern as a bullish reversal sign.
3. Indecision:
A Gravestone Doji can also represent market indecision depending on where it appears within a trend. On its own, it suggests that the buyers and sellers are locked in a tug-of-war, leading to a narrow close despite price fluctuations during the session.
Understanding Gravestone Doji in Different Contexts
Gravestone Doji in an Uptrend
The Gravestone Doji is most significant when it occurs during an uptrend. In these situations, it indicates that the bulls pushed prices to new highs during the session but encountered strong resistance. Sellers ultimately gained control, dragging the price back down to close near the opening price. This event signals a potential reversal from bullish to bearish, as market sentiment begins to shift.
For example:
Imagine an asset's price rising steadily over multiple trading sessions. Suddenly, a Gravestone Doji appears, where intraday highs were stifled by sellers. If the following candles confirm the bearish momentum (e.g., with a red candle or additional patterns like bearish engulfing), it may signify the beginning of a downward trend.
Gravestone Doji in a Downtrend
While rare, a Gravestone Doji can form during a downtrend and signal a potential bullish reversal. In this case, sellers fail to push the asset's price lower, as buyers absorb selling pressure and drive the price back to opening levels by the close. However, traders must approach this situation cautiously and look for more conclusive signs of reversal.
Gravestone Doji in Consolidating Markets
In sideways markets or consolidation phases, a Gravestone Doji may appear without signaling a clear trend reversal. Instead, the market may remain undecided as buyers and sellers fail to establish dominance. In this case, traders should use additional indicators or wait for confirming candlestick patterns to determine the market's next move.
Confirming the Gravestone Doji: Tools and Techniques
For traders, the Gravestone Doji should not be used in isolation. It works best when combined with other indicators or signals to confirm its validity. Below are strategies to verify its significance:
1. Volume Analysis:
High trading volume during the Gravestone Doji formation strengthens its reliability as a trend reversal signal. Conversely, low volume could imply weaker conviction and indecision.
2. Support and Resistance Levels:
If a Gravestone Doji emerges near a key resistance level, it becomes a stronger indication of bearish reversal. Similarly, a Gravestone Doji near support could hint at a bullish reversal, though confirmation is key.
3. Indicators:
Using technical indicators like the Relative Strength Index (RSI), Moving Average Convergence Divergence (MACD), or Bollinger Bands can provide additional insights. For example, an overbought RSI combined with a Gravestone Doji may suggest bearish reversal potential.
4. Confirming Candles:
Look for subsequent candlestick patterns to validate the reversal. For example, in an uptrend, a Gravestone Doji followed by a bearish engulfing pattern or a long red candle reflects growing bearish sentiment.
How to Trade Gravestone Doji Patterns
The Gravestone Doji offers great opportunities for traders when applied strategically. Here’s a step-by-step guide:
Step 1: Identify the Context
Analyze the prevailing trend (uptrend, downtrend, or consolidation) before interpreting the Gravestone Doji. The pattern’s significance heavily depends on its location.
Step 2: Confirm the Signal
Use secondary indicators, oscillators, or price action tools to validate the potential for trend reversal. For example:
- In an uptrend, check if RSI shows overbought levels.
- In a downtrend, confirm bullish momentum through higher lows or divergence indicators.
Step 3: Execute the Trade
Once confirmed, execute your trade based on the expected reversal.
- For a bearish reversal: Consider shorting the asset or buying put options.
- For a bullish reversal: Go long or buy call options.
Step 4: Manage Risk
Regardless of your position, managing risk is crucial. Place stop-loss orders near recent highs or lows to protect against unfavorable moves.
Step 5: Monitor the Market
Keep track of price action and adjust your strategy accordingly. If the reversal does not play out, exit the trade to minimize losses.
Real-Life Example of Gravestone Doji
Consider the following scenario in the stock market:
A technology stock rallies over several weeks, reaching a historical resistance level. One trading session opens at $150 and shoots up to $160 intraday, only to close back at $150—a perfect Gravestone Doji formation. The upper shadow indicates bullish exhaustion, and the closing price reflects increased selling activity. Subsequent bearish candles lead to a price drop to $135, confirming the reversal.
Conclusion
The Gravestone Doji is a powerful candlestick pattern for identifying potential trend reversals. Its characteristic structure—a long upper shadow, a small or non-existent real body, and no lower shadow—provides key insights into market sentiment. While it is often associated with bearish reversals, it can also signal bullish reversals or market indecision under specific conditions.
However, traders must remember that no single pattern guarantees success. Combining the Gravestone Doji with additional tools like volume analysis, technical indicators, and confirming candlestick patterns will improve accuracy and help you make informed trading decisions.
By mastering the Gravestone Doji and incorporating it thoughtfully into your trading strategy, you can gain an edge in identifying key market turning points. Whether dealing with stocks, forex, or cryptocurrencies, understanding candlestick patterns like the Gravestone Doji is fundamental to navigating volatile markets with confidence.